Outside-in Dashboard
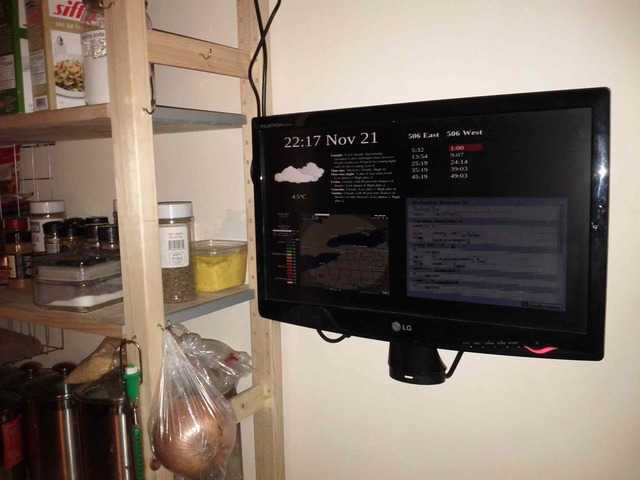
The outside-in dashboard is a display, mounted on the wall near the door, that keeps me constantly connected with my immediate surroundings, including weather and public transit.
Background
The biggest problem with living indoors is that you lose track of what’s happening outdoors. Of course, that’s also part of the point of going inside. When it’s cold or raining it can be kindof miserable to stand outside. Most of the time we’re either inside or outside and things are pretty tolerable, but the problem occurs when we transition: if you walk outside without the right coat or whatever, you’re going to have a bad time.
The solution just comes down to data. If I can put it on a display next to the door, then I will always know what I’m getting myself into when I’m in the process of going outside. While we’re at it, the weather isn’t the only thing I care about. One of the biggest frustrations with leaving my apartment is arriving at the transit stop only to find that the next train isn’t arriving for 15 minutes. It’s so avoidable!
I was quite impressed with the Google Now presentation, which occurred at Google I/O 2012. The vision of having access to data so quickly that it is like knowing it is very appealing. Although I have a whole slew of apps on my phone, they take too long to load. 50 seconds is way too long for finding arrival times for a bus stop, and even Google Now is too slow with its 5-second startup. What I need is really instant, and the best way to do that is to make something that never turns off.
Methods
So this thing is screwed into the wall with a VESA mount.
Control
It’s controlled by a chromebook, and this deserves to be described. In most ways, it’s self-administering. Of course, there’s a catch: sleep needs to be disabled and this is non-trivial. I mean, it’s easy, but it’s impossible to automate so this process needs to be repeated each time the system is powered on. In the past 9 months, I’ve only needed to turn it off once.
The software all runs on a linux server and it’s hosted via nginx. I’m going to share this code in the near future, but suffice to say it’s a terrible hack at the moment. One cron job handles public transit and the rest of the display is a bunch of HTML frames. Since the chromebook is basically just a glorified web browser, it lends itself to displaying an HTML display very nicely. Thus, the dashboard is actually just a web page.
Public Transit
I want to know when street cars are approaching a specific intersection, and luckily this data is available through the good folks at NextBus.
Weather, Time, and stuff
I prefer to make my own weather predictions, and this involves reading the official regional prediction then double-checking it against the a 1-hour animated doppler loop to get a sense of the local conditions. This type of radar map is available as a .GIF from places like the US national weather service and wunderground. It’s also useful to get the current temperature and whatnot.
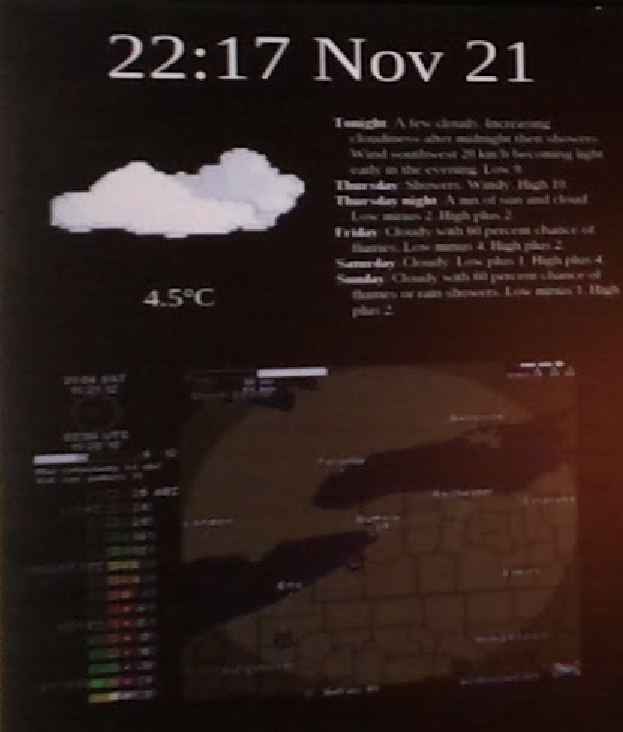
There’s a clock, date, and day of week. This just makes sense.
Considerations
light at night time
This thing is on 24/7, meaning it could be a real pain during the night if it’s too bright or anything. One solution would be to dynamically control the brightness of the display, but since I’m running this on a chrombook, I didn’t feel like digging into the specifics of accomplishing that. Instead, I just ensured the display is dim in two ways:
- The monitor has a hardware control, so I set this at the lowest setting
- the display is composited as HTML and CSS, so I put a transparent black layer on top of the whole page to dim the whole display
On the second point, I could make this vary as a function of the time of day. Maybe later.
electricity use
Since this is on all the time, I couldn’t help but wonder what the energy damage would be. Turns out it’s less than a light bulb: 23-25 watts. Now that’s non-negligible (I mean, who would keep even a 25-watt bulb on all day?) but I think the cost is worth it. Remember: the point is to have the information immediately, and the cost of making that possible is the cost of a light bulb. Consider that this is a light matrix instead of a single point of light, and even though it behaves much like a light, it does so much more with its systematic illumination of a grid of tiny pixels.
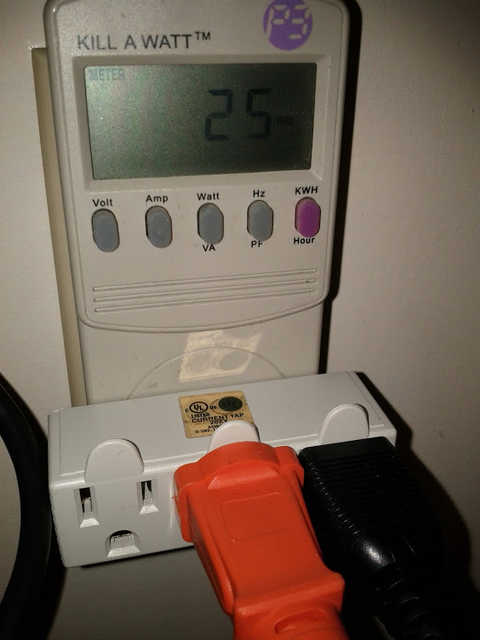
Check it out. The Kill-a-watt registers 25 watts in this picture.
conclusions
This report is in-progress. I’m probably going to update it as I learn more about living with something like this. The software will, of course, become public in short order. The board has been in operation since about October 2012, and it’s a valuable part of daily life.
I mean: this last part is worth revisiting. I use this thing multiple times per day. I am less able without it. Unfortunately, the transit predictions sometimes turn all wonky (the API is to blame) and I actually need to do some administration on this thing every 3 months or so. It’s more of a pain than I’d like, actually… But I wouldn’t give it up. It’s here to stay.
The outside-in dashboard rocks.